

Sutton's claimant count rose by 140 in September to 4,795, or 3.5% of working-age residents. London's rate is 5.6%, and only four boroughs are lower.
There were 4,795 people claiming unemployment-related benefits in the borough of Sutton in September 2026. That is up by 140 on August, and it is 3.5 per cent of residents aged 16 to 64. The Office for National Statistics released the figures on Tuesday 20 October (ONS claimant count by local authority).
It is the largest monthly rise in the borough since February, when the count went up by 155. Over the year the change is much smaller: September 2025 recorded 4,730 claimants, so the borough is 65 higher than a year ago.
August was revised down by 100
Last month we reported an August figure of 4,755, which is what the ONS published on 15 September. The ONS has since revised August to 4,655. Its local claimant figures are revised as late claims are processed, which is why the September rise is 140 and not 40.
Using the revised series, August was up 30 on July, not 130. We have added a note to our August story.
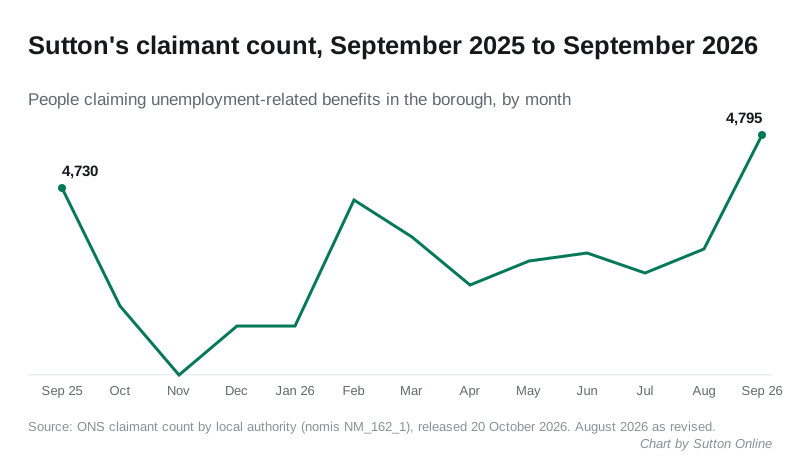
The month-by-month count, from the same ONS series on nomis:
| Month | Claimants | Rate |
|---|---|---|
| September 2025 | 4,730 | 3.5% |
| October 2025 | 4,585 | 3.4% |
| November 2025 | 4,500 | 3.3% |
| December 2025 | 4,560 | 3.3% |
| January 2026 | 4,560 | 3.3% |
| February 2026 | 4,715 | 3.5% |
| March 2026 | 4,670 | 3.4% |
| April 2026 | 4,610 | 3.4% |
| May 2026 | 4,640 | 3.4% |
| June 2026 | 4,650 | 3.4% |
| July 2026 | 4,625 | 3.4% |
| August 2026 (revised) | 4,655 | 3.4% |
| September 2026 | 4,795 | 3.5% |
How Sutton compares with its neighbours
Sutton is still near the bottom of the London table. London’s rate is 5.6 per cent and the United Kingdom’s is 3.9 per cent. Only four of the 33 London areas are lower: the City of London (1.1 per cent), Richmond upon Thames (2.6), Kingston upon Thames (3.2) and Kensington and Chelsea (3.4). Bexley and Bromley match Sutton on 3.5 per cent.
| Area | Claimants as % of 16 to 64s, September 2026 |
|---|---|
| Kingston upon Thames | 3.2% |
| Sutton | 3.5% |
| Wandsworth | 4.0% |
| Merton | 4.6% |
| London | 5.6% |
| Croydon | 6.4% |
Croydon’s rate is 6.4 per cent, nearly double Sutton’s. At the top of the London table are Newham and Barking and Dagenham, both on 7.5 per cent.
Who the 4,795 are
The ONS breaks the borough figure down by age and sex:
- aged 16 to 24: 795, up 50 on revised August
- aged 25 to 49: 2,840, up 95
- aged 50 and over: 1,160, down 10
- men: 2,450, women: 2,340
So the September rise came from people under 50. The over-50s were the only group to fall.
What the claimant count is, and what it is not
This is not the unemployment rate. The claimant count records people claiming benefits principally for the reason of being unemployed. Since Universal Credit replaced Jobseeker’s Allowance for most claimants, it also includes some people in low-paid work who are required to look for more. The ONS unemployment rate is a separate measure, built from a survey.
The ONS classes these local figures as official statistics in development, its label for statistics still being tested. They are also revised, as August shows. The next release, covering October, is due on 17 November 2026.
What it means for you
If you are out of work in the borough, Universal Credit claims are made through GOV.UK. The council’s pages cover benefits and money support.
If you are reading the figure as a sign of the local economy, one month is not a trend. September’s count is the highest since June 2025, but the borough’s rate has stayed between 3.3 and 3.6 per cent for two years. Watch whether October’s figure, and the revised September one, hold at this level.
Sources
- ONS: claimant count by unitary and local authority, released 20 October 2026, next release 17 November 2026
- nomis: claimant count dataset NM_162_1, for the Sutton monthly series including the revised August figure, the age and sex breakdown and the London borough comparison
Our other Sutton data pages cover house prices, council tax bands and planning applications.
Have your say