
The average Sutton home sold for £446,775 in June 2026 (Land Registry). Prices by type, the £1m detached market, and how the borough compares to London.
Whether you are buying your first flat near the station, trading up to a semi in Worcester Park or wondering what your Cheam house is now worth, the same problem comes up: every website quotes a different “average Sutton price”. The figure that actually matters is what homes genuinely change hands for, recorded by HM Land Registry once every sale completes. This is a plain read of those numbers for 2026: the borough average, which way it is moving, what each property type costs, where the expensive corners are, and how Sutton sits against London and England.
The headline figure for 2026
The average home in the borough of Sutton sold for £446,775 in June 2026. That is the provisional figure from the official UK House Price Index, published on 19 August 2026 and built from completed Land Registry sales rather than asking prices.
Over the year to June 2026 prices edged up 0.4%, or £1,731. That does not sound like much, but it happened while London as a whole fell 2.5%, and prices fell in 19 of the 33 London boroughs. Sutton was one of the 14 still moving in the right direction. The borough’s standing offer is doing the work: family houses around £107,000 cheaper than the London average, the grammar schools, and a 40-minute rail link into the centre keep a steady stream of buyers arriving from pricier boroughs, and that demand held values up through a soft year for the capital.
One thing to watch when you compare sources. Portals quote different geographies: Rightmove’s Sutton page shows an overall average of about £490,000 for the past year, and Plumplot’s figures for the SM postcode area average £506,000, but the SM area stretches well beyond the borough, taking in Morden and Banstead. Always check whether a “Sutton” figure means the borough, the postcode area or just the town before you rely on it.
What it means for you
If you are selling, a market rising by less than 1% a year is not a seller’s frenzy: buyers have choice, and realistic pricing from day one still matters. If you are buying, houses are holding firm but flats have softened, so the negotiating room is at the bottom of the ladder. Check the council tax band of any home you view, since Sutton’s rates are among the higher bills in London and it is a running cost of the property. If you are staying put, your home has gained a little in cash terms over a year in which most of London slipped.
Prices by property type
The borough average hides a wide spread. These are the Sutton averages for June 2026 from the UK House Price Index:
- Detached houses: £1,022,308, down 1.1% on the year. The average detached home in this borough still costs seven figures, concentrated in South Cheam, Belmont and Carshalton Beeches.
- Semi-detached houses: £648,308, up 1.1%. The classic Sutton family move.
- Terraced houses: £456,712, up 1.7%, the borough’s strongest segment and now sitting just above the borough average.
- Flats and maisonettes: £281,416, down 0.9%. The most affordable way in, and one of the two segments where prices fell.
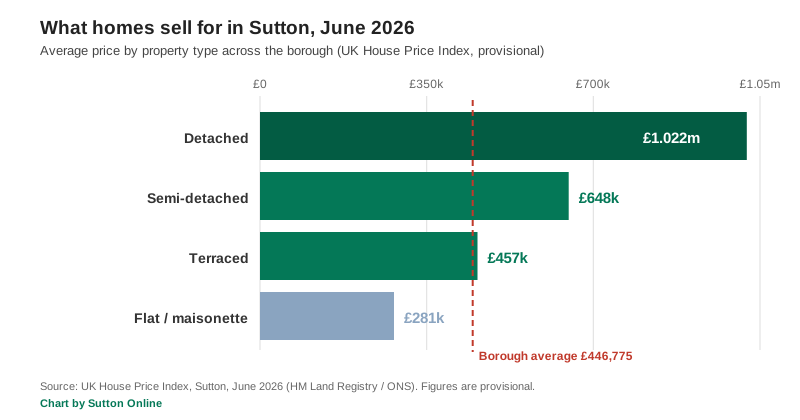
The pattern is the same one showing across outer London: terraced and semi-detached houses are edging up, while flats and the top of the detached market are softening. Flat buyers are the most exposed to mortgage rates and service charges, and with most of the borough’s new-build stock being town-centre flats, supply there is plentiful.
First-time buyers and home movers
The same dataset splits buyers usefully. A first-time buyer in Sutton paid an average of £366,802 in June 2026, up 0.5% on the year. A former owner occupier, meaning someone moving home rather than buying a first one, paid an average of £586,128, up 0.4%. The £219,000 gap between those two figures is, in practice, the size of the step from a first flat or small terrace to a family house here.
The priciest corners, and the most affordable
The top of the Sutton market lives on the southern, greener side of the borough. Plumplot’s postcode-sector data, compiled from Land Registry sales, puts the most expensive pocket of the SM area in SM2 7, the South Cheam side of the borough south of the town centre, at an average of about £1.0 million. That is the land of wide plots and detached houses between Cheam Village and Belmont.
At the other end, the most affordable sector is SM1 4, covering the town centre itself, at around £380,000. That is no mystery: central Sutton is where the borough’s flats are stacked, and flats anchor the average. The broad rule holds across the borough: prices climb as you head south and west into Cheam, Belmont and Carshalton Beeches, and ease towards the town centre and the St Helier side, where the stock is smaller and denser.
How Sutton compares to London and England
| Area | Average price (June 2026) | Change over the year |
|---|---|---|
| Borough of Sutton | £446,775 | +0.4% |
| London | £553,870 | -2.5% |
| England | £293,262 | +1.8% |
All three figures come from the UK House Price Index for June 2026. In plain terms, the average Sutton home costs about £107,000 less than the average London home and about £154,000 more than the England average. For a borough where the average detached house tops £1 million, that discount to the capital is what keeps the market turning over, and it is why Sutton edged up through a year in which London as a whole fell.
Frequently asked questions
What is the average house price in Sutton?
The average home in the borough of Sutton sold for £446,775 in June 2026, according to the provisional UK House Price Index built from HM Land Registry sales. That covers all property types across the whole borough, from Worcester Park to Wallington.
Are Sutton house prices going up or down in 2026?
Gently up: 0.4% in the year to June 2026, against a 2.5% fall for London as a whole. Terraced houses rose 1.7% and semis 1.1%, while flats fell 0.9% and detached homes fell 1.1%.
How much does a house cost in Sutton compared to a flat?
In June 2026 the average terraced house cost £456,712 and the average semi £648,308, while the average flat cost £281,416. Detached homes averaged £1,022,308, making Sutton a borough where the typical detached house is a seven-figure purchase.
Where are the most expensive homes in Sutton?
On the southern side of the borough. Land Registry data compiled by Plumplot puts the SM2 7 sector, the South Cheam and Belmont side south of the town centre, at an average of about £1.0 million, roughly two and a half times the cheapest sector, the flat-heavy town centre.
Is Sutton cheap for London?
Relatively, yes. The borough average of £446,775 is about £107,000 below the London average of £553,870, and for that money you are typically buying a house with a garden rather than a flat, which is precisely why demand from inner London stays firm.
Where can I check what a specific house sold for?
Every completed sale in England and Wales is public. Look up any street or address free on the HM Land Registry Price Paid service, or browse the same data on Rightmove and Zoopla.
Sources
- UK House Price Index, Sutton (ONS / HM Land Registry) for the borough average, property-type and buyer-type figures.
- UK House Price Index open data (HM Land Registry) for the London and England June 2026 comparisons.
- Plumplot Sutton house prices (SM postcode area, from Land Registry data) for postcode-sector context.
- Rightmove Sutton house prices for portal-average context.
- HM Land Registry Price Paid search to check any individual address.
Figures are provisional and revised as more sales complete. Always confirm the latest numbers against the linked HM Land Registry and ONS sources before making a decision. Our other guides cover Sutton council tax bands, trains to London and Sutton planning news.
Have your say