
Terraced homes in Sutton averaged a record £464,085 in July and semis £657,577, both the highest since 1995. Flats fell 1.6%. The borough average is £452,654.
The average terraced house in Sutton was worth £464,085 in July, the highest figure the Land Registry has ever recorded for the borough. Semi-detached homes set a record too, at £657,577.
Both beat anything in the index since it began in January 1995, and they did it while London as a whole was falling. The figures come from the UK House Price Index, published by HM Land Registry on 16 September 2026.
One number to hold on to before anything else: the UK House Price Index publishes a mean average, not a median. A handful of large sales pull it upwards, so it sits above the price most people actually pay.
The borough average, and the split underneath it
Across all property types, the average Sutton home reached £452,654 in July, up £2,857 on July 2025, a rise of 0.6 per cent.
The borough total hides the real story. Year on year to July 2026:
| Property type | Average, July 2026 | Change on July 2025 |
|---|---|---|
| Terraced | £464,085 | up 2.0% |
| Semi-detached | £657,577 | up 1.9% |
| Detached | £1,038,684 | up 0.8% |
| Flat or maisonette | £284,015 | down 1.6% |
Flats are the only type falling, and they have been falling for a while. At £284,015 they are £14,045 below their January 2023 peak of £298,060. Terraced and semi-detached homes have now cleared their 2023 peaks; flats have not come close.
Detached homes have turned around. In June they were down 1.1 per cent on the year. In July they are up 0.8 per cent, though at £1,038,684 they remain just short of the January 2023 record of £1,044,527.
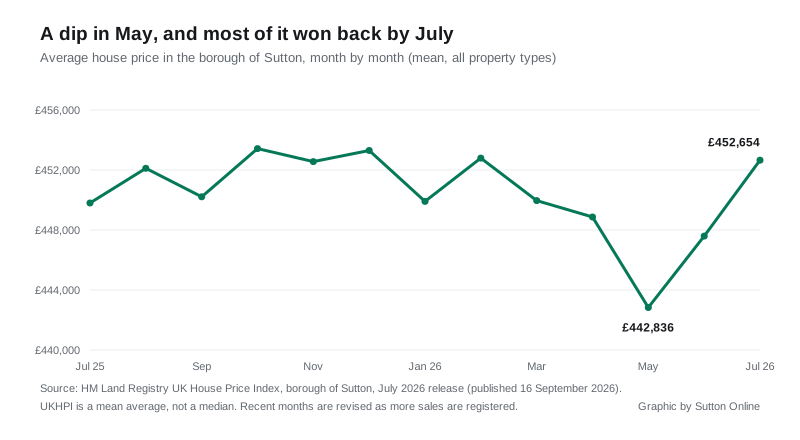
The year has not been a straight line. Prices peaked at £453,425 last October, sank to £442,836 in May, and have climbed back in the two months since. The borough average is still £3,619 short of its all-time high, the £456,273 recorded in January 2023.
Sutton is one of only 12 London boroughs where prices rose
On the same release, prices fell in 21 of London’s 33 boroughs and rose in 12. Sutton ranks tenth on annual change.
- Risers: Barking and Dagenham 5.3%, Kingston upon Thames 3.3%, Waltham Forest 2.8%, Havering 2.1%, Bexley 2.0%, Hounslow 1.7%, Haringey 1.0%, Ealing 0.8%, Lewisham 0.7%, Sutton 0.6%, Enfield 0.6%, Southwark 0.1%
- Steepest falls: the City of London 17.4%, Westminster 20.7%, Tower Hamlets 14.4%, Kensington and Chelsea 14.1%, Camden 10.1%
London as a whole fell 3.3 per cent to £550,037. England rose 1.1 per cent to £293,479.
What the neighbours did
The borough boundary is doing a lot of work this month. Sutton rose while Croydon, on the other side of it, fell.
| Area | Average, July 2026 | Change on the year |
|---|---|---|
| Kingston upon Thames | £591,555 | up 3.3% |
| Epsom and Ewell | £568,214 | up 2.0% |
| Sutton | £452,654 | up 0.6% |
| Merton | £615,890 | down 0.9% |
| Bromley | £511,670 | down 3.1% |
| Croydon | £390,041 | down 3.4% |
Sutton also remains one of the cheaper boroughs in the capital, but the list below it is growing. Only Barking and Dagenham, Croydon, Newham, Bexley, Tower Hamlets and Havering now have a lower average. Tower Hamlets has dropped underneath Sutton in the past year, on the back of a 14.4 per cent fall.
For buyers taking a first step, the Land Registry’s first-time buyer average for Sutton is £371,597, up 0.4 per cent on a year ago.
One correction to last month’s figure
The Land Registry revises its recent months as more sales are registered. In August we reported Sutton’s June average as £446,775, which is what the index said at the time. In the September release, June has been revised up to £447,596, a difference of £821.
That is normal, and it is worth knowing before anyone quotes a single month as settled. The newest two months in the index are also published without a sales count; the most recent month with a completed figure is May 2026, with 106 recorded sales, because registrations lag completions by several months.
What it means for you
- If you own a terraced or semi-detached house in Sutton, the average is at a record. Neither type has been worth more at any point since the index began in 1995.
- If you own a flat, the market has not come back. Flats are down 1.6 per cent on the year and remain £14,045 below their 2023 peak.
- Do not treat the headline as your valuation. It is a mean across the whole borough, and Carshalton, Cheam, Wallington and Worcester Park do not move together.
- Council tax bands were set on 1991 values, not these. Our Sutton council tax bands guide explains what your band actually reflects, and our Sutton house prices page keeps the longer-run picture.
- The next UK House Price Index, covering August 2026, is due in October.
Sources: HM Land Registry UK House Price Index, borough of Sutton, data for July 2026 and comparisons for every London borough, England and London, taken from the Land Registry’s own data service on 19 September 2026; UK House Price Index for July 2026, published 16 September 2026.
Have your say