
Sutton recorded 16,601 crimes in the year to July 2026, up 2.1%. Shoplifting tripled in The Wrythe while burglary fell 14%. Every ward, ranked.
Police recorded 16,601 crimes across the borough of Sutton in the 12 months to July 2026. That is 347 more than in the year before, a rise of 2.1 per cent.
The total hides two very different stories. Burglary, criminal damage and vehicle crime all fell. Shoplifting, public order offences and violence rose, and in one ward, The Wrythe, shoplifting more than tripled.
These are our own counts from the Home Office’s police.uk open data, which publishes every crime the Metropolitan Police records, placed on a map. We added up every report inside the boundary of each of Sutton’s 20 wards for the 24 months from August 2024 to July 2026. July 2026 is the newest month police.uk has published.
What went up and what went down
Year to July 2026, compared with the year to July 2025:
| Type of crime | Year to July 2025 | Year to July 2026 | Change |
|---|---|---|---|
| Violence and sexual offences | 4,969 | 5,362 | up 7.9% |
| Anti-social behaviour | 3,151 | 3,286 | up 4.3% |
| Shoplifting | 1,355 | 1,486 | up 9.7% |
| Vehicle crime | 1,347 | 1,257 | down 6.7% |
| Public order | 1,002 | 1,184 | up 18.2% |
| Other theft | 933 | 950 | up 1.8% |
| Burglary | 887 | 762 | down 14.1% |
| Criminal damage and arson | 1,068 | 699 | down 34.6% |
| Drugs | 630 | 649 | up 3.0% |
| Robbery | 276 | 305 | up 10.5% |
| Theft from the person | 242 | 249 | up 2.9% |
| Other crime | 209 | 226 | up 8.1% |
| Bicycle theft | 117 | 92 | down 21.4% |
| Possession of weapons | 68 | 94 | up 38.2% |
| All crime | 16,254 | 16,601 | up 2.1% |
The good news first:
- Burglary fell by 125 reports, from 887 to 762.
- Criminal damage and arson fell by more than a third, from 1,068 to 699.
- Vehicle crime fell by 90, to 1,257.
- Bicycle theft fell from 117 to 92.
Violence and sexual offences remain the largest category by a distance, at about a third of everything recorded. They rose by 393 reports. Weapons possession rose from 68 to 94. Those counts are small, and a rise in possession offences can reflect more stop and search as much as more knives on the street.
The Wrythe: shoplifting more than tripled
Of the 20 wards, The Wrythe saw the biggest rise. Recorded crime there went from 816 to 1,024, up 25.5 per cent.
Almost all of that was shoplifting. The ward logged 86 shoplifting reports in the year to July 2025 and 285 in the year to July 2026.
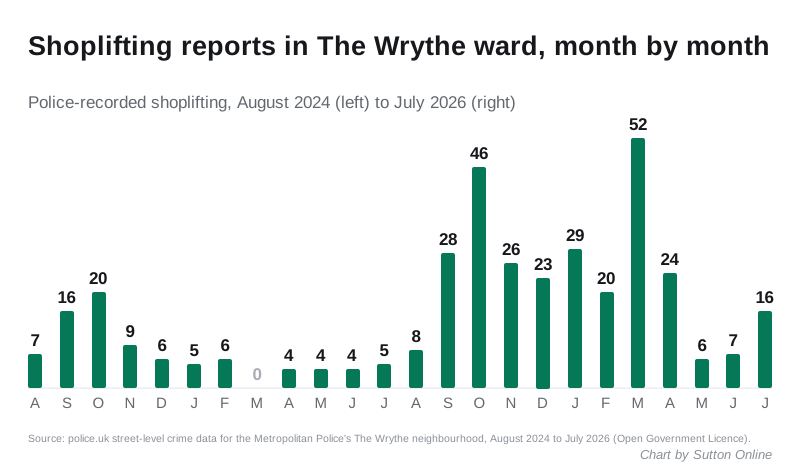
The rise started suddenly in September 2025 and peaked at 52 reports in March 2026. Then it fell away just as fast: 6 in May, 7 in June and 16 in July.
Police.uk does not publish exact addresses. It moves each crime to the nearest of a set of anonymous map points so that victims cannot be identified. In The Wrythe, 281 of the 285 shoplifting reports sit on just two of those points, both just off Green Wrythe Lane. One is labelled “Petrol Station” and went from 31 reports to 188. The other, labelled Jay Mews, went from 52 to 93.
So this is not shoplifting spreading across the ward. It is one small cluster of shops reporting far more of it for about eight months. The data cannot say whether that was more theft, more reporting by a retailer, or both.
Carshalton Central: the same pattern, smaller
Carshalton Central rose 13.1 per cent, from 802 to 907 crimes. Shoplifting there more than doubled, from 89 to 188. The largest share, 123 reports, sits on a single police.uk point labelled “Supermarket”, just off the High Street. A year earlier that point had 64.
Every ward, ranked by change
| Ward | Year to July 2025 | Year to July 2026 | Change |
|---|---|---|---|
| The Wrythe | 816 | 1,024 | up 25.5% |
| Carshalton Central | 802 | 907 | up 13.1% |
| Worcester Park North | 414 | 468 | up 13.0% |
| North Cheam | 629 | 709 | up 12.7% |
| Sutton South | 872 | 980 | up 12.4% |
| St Helier West | 1,244 | 1,343 | up 8.0% |
| Worcester Park South | 306 | 330 | up 7.8% |
| Wallington North | 857 | 899 | up 4.9% |
| Hackbridge | 481 | 497 | up 3.3% |
| Belmont | 524 | 538 | up 2.7% |
| Sutton West and East Cheam | 731 | 750 | up 2.6% |
| Sutton Central | 2,166 | 2,163 | down 0.1% |
| Beddington | 1,044 | 1,038 | down 0.6% |
| Sutton North | 804 | 778 | down 3.2% |
| St Helier East | 690 | 666 | down 3.5% |
| South Beddington and Roundshaw | 1,009 | 956 | down 5.3% |
| Cheam | 551 | 514 | down 6.7% |
| Stonecot | 635 | 585 | down 7.9% |
| Carshalton South and Clockhouse | 539 | 484 | down 10.2% |
| Wallington South | 1,140 | 972 | down 14.7% |
Wallington South had the biggest fall. Most of it was anti-social behaviour, down from 278 reports to 165. Shoplifting there also fell, from 163 to 123.
Sutton South rose 12.4 per cent. Anti-social behaviour went from 205 to 267 and violence and sexual offences from 280 to 334.
Sutton Central: flat overall, but a different mix
Sutton Central, which takes in the town centre and the station, records more crime than any other ward: 2,163 reports, about one in eight of the borough total. Busy town centres always top these tables, because that is where people shop, travel and go out.
Its total barely moved, but the mix changed:
- Public order offences rose from 147 to 199.
- Drug offences rose from 62 to 88.
- Weapons possession rose from 6 to 17.
- Shoplifting fell from 339 to 302.
- Criminal damage fell from 126 to 84.
The month-by-month picture
The borough’s monthly totals follow the usual seasonal shape, lowest in winter and highest in summer. July 2026 had 1,528 recorded crimes, slightly fewer than July 2025’s 1,559. The lowest month of the past year was January 2026, with 1,202.
How we counted, and what the figures cannot tell you
- Police.uk places every crime on an approximate map point. A crime near a ward edge can be counted in the neighbouring ward.
- These are recorded crimes. A rise can mean more crime, more reporting, or more police activity, as with drugs and weapons offences, which are mostly found by officers rather than reported by the public.
- The Met’s own crime dashboard counts slightly differently, so its borough figures will not match ours exactly.
- Police.uk figures for a month appear roughly six to eight weeks after it ends. August’s figures are not out yet.
What it means for you
- Burglary fell by 14 per cent across the borough. The basics still matter: the Met’s home security advice covers locks, lighting and what to do before going away.
- If you run a shop, the Wrythe and Carshalton figures show how quickly one site can dominate a ward’s crime count. Reporting every incident is what puts extra patrols on a map.
- To see crime on your own street, search your postcode at police.uk. It shows the same data we used, month by month.
- To report a crime that is not an emergency, call 101 or use the Met’s online form. In an emergency, call 999.
House prices in the borough are covered in our July house price report.
Sources: police.uk open data API (street-level crimes and Metropolitan Police neighbourhood boundaries for Sutton’s 20 wards, August 2024 to July 2026, Open Government Licence). All counts are Sutton Online’s own, drawn from that data on 25 September 2026.
Have your say